
Direct Line for Business recorded an average stolen-tools claim of £4,206.60 in 2025, compared with £3,314.87 in 2021. Separately, its police-data research counted 25,525 reported tool theft offences in 2024, using usable responses from 29 of 45 police forces contacted. These figures measure different parts of the problem: insured losses and recorded crime within a partial set of forces. Claims source [1]; police-data source [2].
This page brings together tool theft statistics for vans, construction sites and tradespeople, with the period and coverage stated beside each figure. Sources checked on .
In this article
- About these figures
- Key UK tool theft statistics
- How many tool thefts are reported to police?
- How much does tool theft cost?
- Which tools are most commonly stolen?
- Are tools stolen from vans, sites or homes?
- What do construction professionals report about site theft?
- Tool theft by location: London boroughs
- What can individual police-force data tell us?
- What can site supervisors do with the evidence?
- Frequently asked questions
- Sources, definitions and update method
- Download the data
Key UK tool theft statistics
- £4,206.60: the average Direct Line for Business claim involving stolen tools and equipment in 2025. This covers its business customers, rather than every UK theft victim. Aviva / Direct Line [1].
- 12,414 thefts from vehicles: approximately 49% of the 25,525 tool theft offences in Direct Line’s 2024 police-data compilation. Direct Line [2].
- 66% of surveyed tradespeople had experienced tool theft in Markel’s June 2025 survey of 500 UK adults working in trades. This is experience of theft, not an annual victimisation rate. Markel / Censuswide [3].
- 57% selected small or power tools and handheld equipment when BauWatch asked UK construction professionals which items were most commonly stolen from sites in their experience. BauWatch / OnePoll, February 2026 survey [4].
How many tool thefts are reported to police?
Direct Line’s 2024 collection is a useful measure of recorded offences, provided its coverage stays attached to the headline. The 25,525 cases came from police forces that supplied usable Freedom of Information responses. Sixteen of the 45 contacted forces did not contribute usable data. It is therefore a partial count, rather than a complete official UK total. Direct Line methodology [2].
A reported offence is also different from a stolen tool. One vehicle break-in might involve a drill, several batteries and a box of hand tools. Counting that incident once does not mean only one item was taken. Nor does a police record show the value of every uninsured loss or job missed while equipment is replaced.
| Measure | Result | Coverage |
|---|---|---|
| Tool theft offences | 25,525 | Usable data from 29 police forces |
| Tool thefts from vehicles | 12,414 | Subset of the reported offences |
| Vehicle share | 48.6%, or about 49% | 12,414 divided by 25,525 |
Source: Direct Line for Business [2]. Vehicle thefts here mean tools stolen from a vehicle. They should not be confused with theft of the vehicle itself.
Why the newer 2025 headline is not used as a comparable total
An October 2026 Aviva release gives a newer police-data headline for 2025. However, its footnote says the information was obtained in the first quarter of 2025, while the headline refers to the full 2025 calendar year. It also does not establish the responding-force coverage. Until those details are clarified, a year-on-year comparison with the 2024 collection would imply more certainty than the published methods support. The separately described claims-cost series remains useful below. Aviva release and footnotes [1].
How much does tool theft cost?
The average Direct Line for Business claim involving stolen tools and equipment rose from £3,314.87 in 2021 to £4,206.60 in 2025. That is a cash increase of £891.73, or approximately 26.9%, calculated from its published series. These figures are not adjusted for inflation. Aviva / Direct Line claims analysis [1].
Scroll horizontally to view the full chart on a small screen.
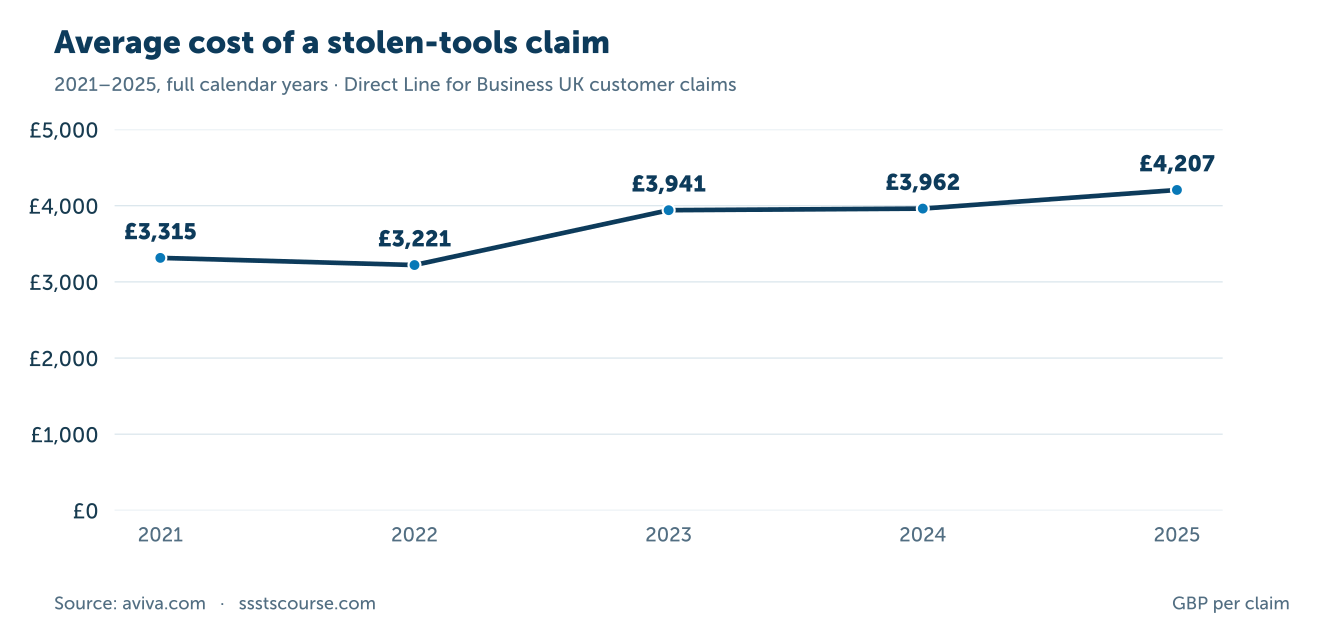
Nominal amounts, not adjusted for inflation. These are one insurer’s claims, not the average loss for every UK theft. Partial 2026 appears separately in the table.
| Period | Average claim cost |
|---|---|
| 2021 | £3,314.87 |
| 2022 | £3,220.87 |
| 2023 | £3,940.96 |
| 2024 | £3,962.01 |
| 2025 | £4,206.60 |
| January–September 2026 only | £3,980.40 |
Source: Aviva, published 30 October 2026 [1]. The latest figure covers nine months. Claims counts and changes in the insured customer mix are not published, so this series cannot establish whether the number of thefts increased.
An average claim, a survey respondent’s equipment loss and a national cost estimate answer different questions. Claims reflect the losses reported under particular policies. A survey can also capture losses that were never insured. An industry-wide estimate may multiply an assumed average loss by an estimated number of incidents.
For an individual business, replacement tools are only one part of the impact. A useful incident record separates equipment value, vehicle or storage damage, hired replacements and work disrupted. That makes its own financial exposure clearer than applying a national average to every incident.
Which tools are most commonly stolen?
In Markel’s 2025 survey, 56% of respondents who had experienced theft reported a stolen drill. Electric screwdrivers and batteries followed. These results describe victims’ reported experience; they do not measure the chance of each type of tool being stolen per item owned. Markel survey [3].
Scroll horizontally to view the full chart on a small screen.
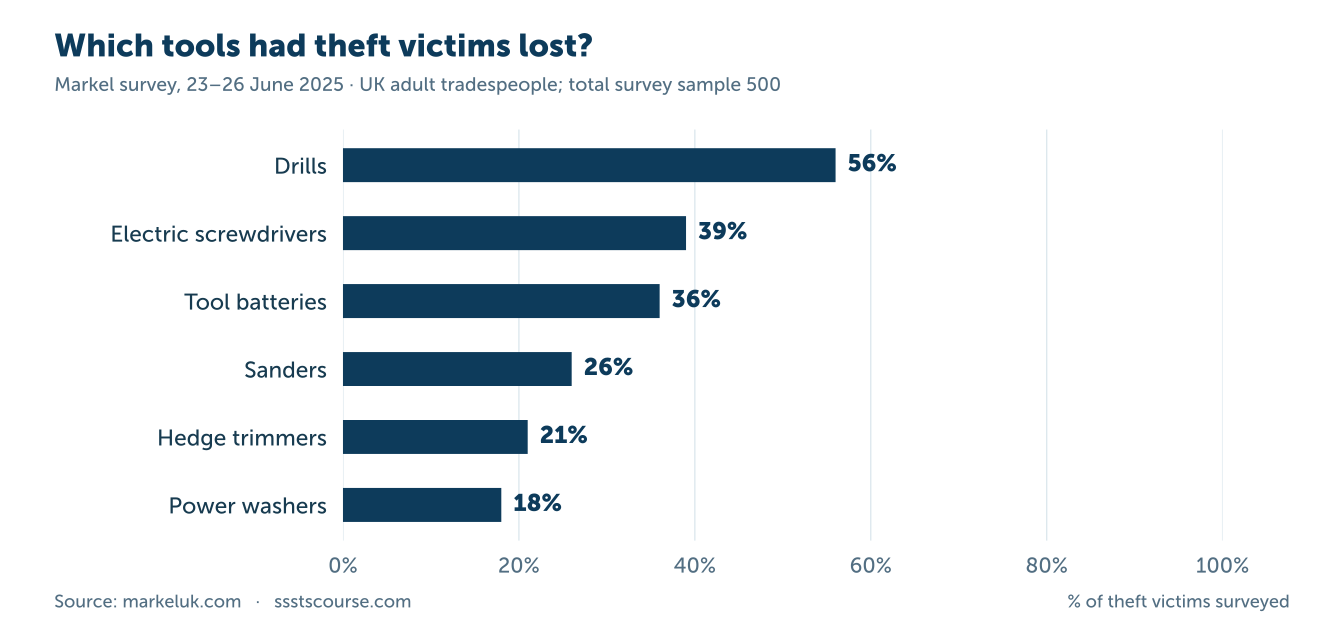
Respondents who had experienced theft could report different tool types. Percentages are not a distribution of police offences and do not sum to 100. Use a 0–100% scale.
| Tool type | Share of victims surveyed |
|---|---|
| Drills | 56% |
| Electric screwdrivers | 39% |
| Tool batteries | 36% |
| Sanders | 26% |
| Hedge trimmers | 21% |
| Power washers | 18% |
Source: Markel / Censuswide [3], fieldwork 23–26 June 2025; total survey sample 500 UK tradespeople aged over 18. A victim could report several types, so the percentages should not be added.
Are tools stolen from vans, sites or homes?
The evidence covers all three. Direct Line’s police compilation shows the scale of theft from vehicles. Markel’s survey also reports incidents on construction sites, in vans parked at work or home, in public car parks, and from sheds, garages and inside homes. Its published location findings are shown below. Markel location results [3].
| Location | Published percentage |
|---|---|
| Construction site | 40% |
| Van parked on site | 35% |
| Van parked at home | 29% |
| Van in a public car park | 22% |
| Shed or garage | 18% |
| Inside a home | 7% |
Source: Markel [3]. The full questionnaire and question-level response base are not published. Categories can overlap, and these percentages should not be interpreted as annual risks or shares of all police-recorded offences.
Location alone cannot establish which storage arrangement is safest. There are different numbers of tools kept in vans, houses and site stores, and they spend different amounts of time there. A valid risk comparison would need those exposure figures as well as incident counts.
What do construction professionals report about site theft?
BauWatch’s 2026 research, conducted by OnePoll in February, included 500 UK construction-sector professionals. Asked which items were most commonly stolen from sites in their experience, 57% selected small or power tools and handheld equipment. This makes tools the most frequently selected category in that survey. BauWatch survey overview [4]; report, page 26 [4].
Scroll horizontally to view the full chart on a small screen.
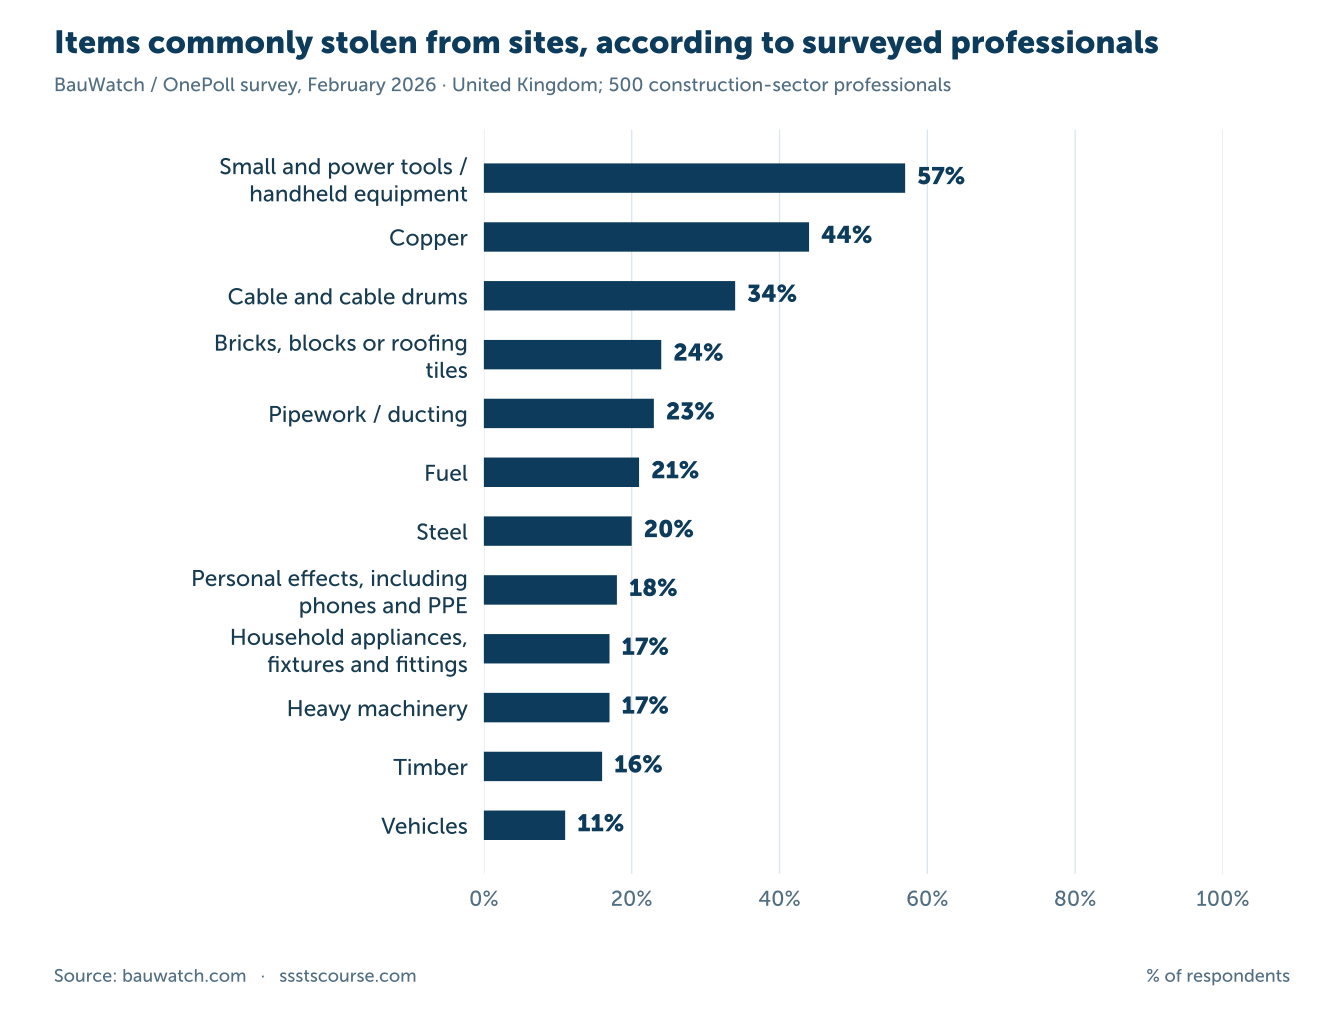
Question: most common items stolen from construction sites in respondents’ experience. Multiple categories; not a count of crimes or the share of all UK sites experiencing theft. Rounded source values. Use a 0–100% scale.
| Item category | Respondents selecting it |
|---|---|
| Small and power tools / handheld equipment | 57% |
| Copper | 44% |
| Cable and cable drums | 34% |
| Bricks, blocks or roofing tiles | 24% |
| Pipework / ducting | 23% |
| Fuel | 21% |
| Steel | 20% |
| Personal effects, including phones and PPE | 18% |
| Household appliances, fixtures and fittings | 17% |
| Heavy machinery | 17% |
| Timber | 16% |
| Vehicles | 11% |
Source: BauWatch Crime Report 2026, page 26 [4]. Rounded published percentages; respondents could identify multiple categories. The 57% figure does not establish that 57% of all UK sites suffered a tool theft during 2026.
Tool theft by location: London boroughs
MoneySuperMarket’s Metropolitan Police FOI analysis publishes a top ten of London boroughs for thefts of tools from vans in calendar 2024. Barnet has the largest published count, at 742, followed by Hillingdon with 596 and Enfield with 567. These are reported thefts, not individual tools stolen. MoneySuperMarket’s original FOI publication [5]
Scroll horizontally to view the full chart on a small screen.
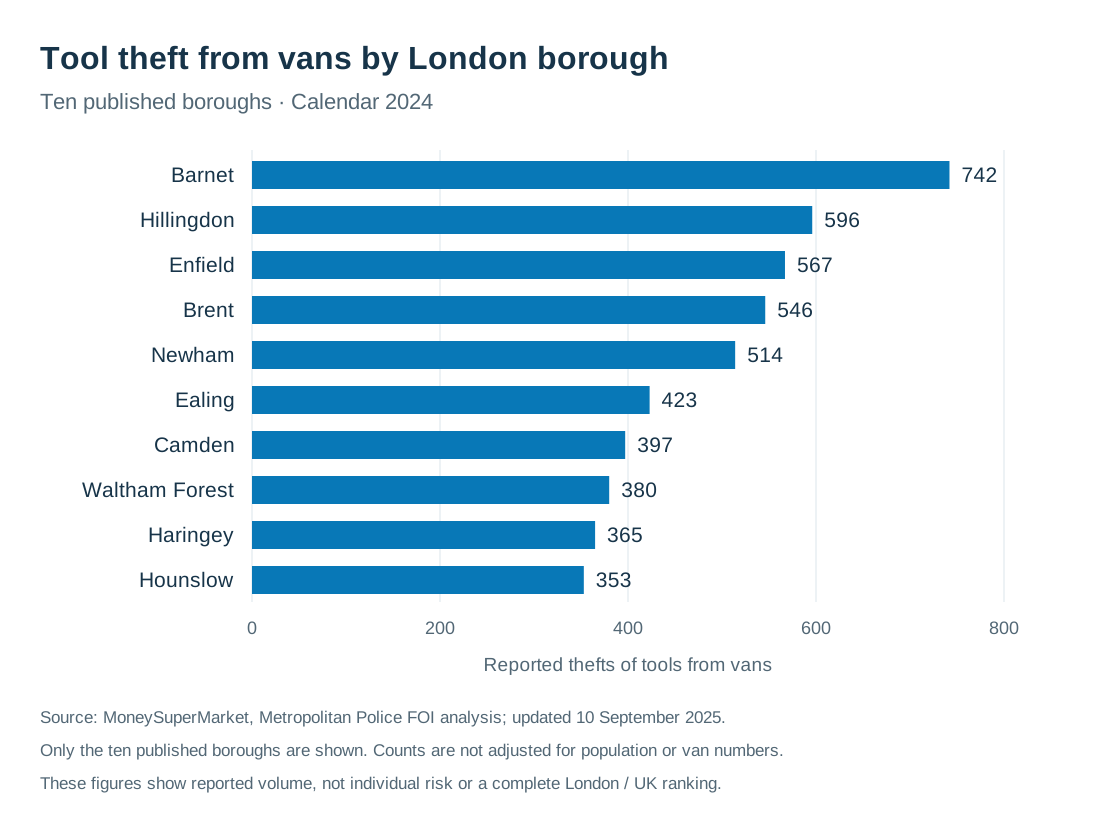
Ten published boroughs only. Counts are not adjusted for population, tradespeople or van numbers and do not measure individual risk. [5]
| London borough | Reported thefts |
|---|---|
| Barnet | 742 |
| Hillingdon | 596 |
| Enfield | 567 |
| Brent | 546 |
| Newham | 514 |
| Ealing | 423 |
| Camden | 397 |
| Waltham Forest | 380 |
| Haringey | 365 |
| Hounslow | 353 |
The source publishes these ten borough counts rather than a complete borough table. They should not be added together and presented as a London total. This local, van-only comparison also cannot be combined with all-setting tool-theft figures from other police forces to create a UK league table.
What can individual police-force data tell us?
Direct police releases can give a clearer definition and a consistent local series. They still need careful labels: a record involving tools or machinery is broader than handheld-tool theft, while a crime recorded at a building site can involve materials or other property.
Northern Ireland: offences involving tools or machinery
PSNI published monthly figures for 2024 and 2025 covering burglary, robbery and theft offences where stolen property was described as tools or machinery. Summing its monthly cells gives the annual totals below. The vehicle column is already included in the overall figure. PSNI FOI/16631 [6].
| Year | All relevant offences | Of which: theft from a vehicle |
|---|---|---|
| 2024 | 260 | 41 |
| 2025 | 227 | 57 |
The overall count fell while the vehicle subset rose. That illustrates why one headline cannot describe every type of theft. PSNI cautions that the figures depend on how property was entered into its live recording system and can be revised. PSNI definitions and source table [6].
West Yorkshire: a comparable local tools-and-machinery series
West Yorkshire Police’s February 2026 disclosure counts crimes linked to property recorded as stolen machinery or tools. On that consistent local definition, recorded crimes fell from 2,997 in 2024 to 2,195 in 2025, a calculated reduction of 26.8%. The longer series shows fluctuations rather than an uninterrupted decline. West Yorkshire Police, FOI 2860564/26 [7].
| Year | Recorded crimes |
|---|---|
| 2019 | 4,811 |
| 2020 | 3,310 |
| 2021 | 2,906 |
| 2022 | 3,357 |
| 2023 | 2,827 |
| 2024 | 2,997 |
| 2025 | 2,195 |
This is a police-force-area series, not a UK trend or a count restricted to construction workers. It includes machinery as well as tools and depends on the property coding in the live crime system. Later extracts can revise earlier years.
What does a local recovery figure actually measure?
A separate January 2026 West Yorkshire disclosure lists 6,583 stolen machinery-or-tool property items linked to 2024 crimes, of which 157 were recorded as recovered. That is 2.4%, calculated as 157 ÷ 6,583. The denominator is property items, not crimes, victims or all stolen tools in the UK. West Yorkshire Police, FOI 2791472/25 [7].
This snapshot does not establish how many owners eventually received equipment back. It also should not be joined to the crime table above as though both were extracted at the same time: the January and February disclosures contain small revisions to historical crime counts. We use the February disclosure for the full-year trend and the January disclosure only for its separately defined item-recovery measure.
Separate measure: crimes recorded at building sites
| Year | Recorded offences |
|---|---|
| 2020 | 414 |
| 2021 | 358 |
| 2022 | 444 |
| 2023 | 523 |
| 2024 | 507 |
| 2025 | 424 |
Source: West Yorkshire Police, FOI 3152773/26 [8]. This is a broader site-crime measure, not a tool-only count. The response also reports 216 offences for January–July 2026; that incomplete year is kept outside the annual comparison.
These examples are not a league table. Comparing the two forces directly would mix different property and location definitions. A defensible geographic ranking needs the same offence definition, period and collection method, plus a suitable denominator if it claims to measure risk.
For teams planning staffing and equipment responsibilities together, our construction site supervisor salary guide distinguishes trade supervision from more specialist contractual roles.
What can site supervisors do with the evidence?
The figures support checking both everyday portable equipment and the arrangements around it. An inventory should make it possible to identify a tool, establish ownership and see when something is missing. Police guidance recommends recording serial numbers and photographs, marking tools, and considering a lockable cabinet in a van. Police.uk tool-theft guidance [9].
The National Business Crime Centre also recommends registering tools on a property database. For a site team, a practical application is to agree who records shared equipment, who checks it back into storage and what happens when a loss is discovered. Those responsibilities should be clear to subcontractors as well as employees. National Business Crime Centre guidance [10].
Security arrangements sit alongside the wider task of supervising safe work. The CITB SSSTS course develops knowledge of health, safety, welfare and environmental responsibilities, including communicating with teams and recognising site risks. Site-specific equipment controls still need to reflect the work, storage and access arrangements.
Frequently asked questions
Is tool theft rising in the UK?
The sources do not support a single unqualified answer. Claims costs, police offence counts and survey experiences measure different things. The Direct Line average claim rose between 2021 and 2025, but that does not show that the number of thefts rose. A national trend also requires comparable police-force coverage. Within West Yorkshire’s consistently defined local tools-and-machinery series, the recorded count fell 26.8% from 2024 to 2025; that is evidence about one force area, not the whole country. West Yorkshire Police disclosure [7].
What percentage of stolen tools are recovered?
There is no current UK-wide recovery rate established by these sources. A specific local example is West Yorkshire’s 2024 property-item snapshot: 157 of 6,583 stolen machinery-or-tool items were recorded as recovered, or 2.4%. West Yorkshire Police recovery data [7]. Survey questions may ask whether a victim recovered any equipment, while police measures can count recovered items or solved offences. Those are different outcomes and should not be substituted for one another.
Does a figure of 66% mean two thirds of tradespeople were robbed last year?
No. Markel’s survey asked about experience of theft without publishing an annual reference period for that figure. It should be described as respondents who had experienced tool theft, with the June 2025 survey date attached.
Can these averages predict the cost of one theft?
No. A lost drill, a full van of equipment and an uninsured specialist tool create different losses. Keep the value and replacement lead time of your own equipment documented, rather than treating a survey or claims average as a fixed allowance.
Sources, definitions and update method
We prioritise original police disclosures, insurer research and survey reports. The downloadable data retains source links, periods, units, coverage and calculation notes. The PSNI annual totals are our sums of the published monthly table. The West Yorkshire annual change and recovery percentage are our calculations from separate police disclosures; their extraction dates and denominators remain distinct. Other chart values reproduce the source figures. BauWatch’s item categories were checked against the report’s original question and table.
We keep police-recorded offences, survey responses and insurance claims separate. Counts are not rates, claims are not every uninsured loss, and an experience-based survey result is not automatically an annual prevalence estimate. Multi-select survey percentages can overlap. Monetary values are in nominal pounds unless stated otherwise.
The police examples retain their original geography and definitions. We do not add them to the Direct Line compilation because overlap is not established. The latest claims table separates partial 2026 from full years. Future updates should replace comparable series together and check collection methods before claiming a national rise or fall.